
What are the 3 V's of big data?
What are the 3 v’s of big data? Find out more as the data experts at Optalitix explain what they mean by using examples to illustrate each of them.


If you are trying to get to grips with what is meant by big data but are finding it difficult, you're not the only one. Big data is a common shorthand that many people don’t truly understand.
However, there is an easier way to understandit, by getting to know three main concepts.
These are the 3 V’s of big data: volume, velocity and variety. By fully understanding these concepts, you can get a better grasp of how big data can open doors for your business and how it can be used it to your advantage.
In this guide, our team of data experts take a closer look at the 3V's and how they relate to big data and how thy are very different from old data management processes.
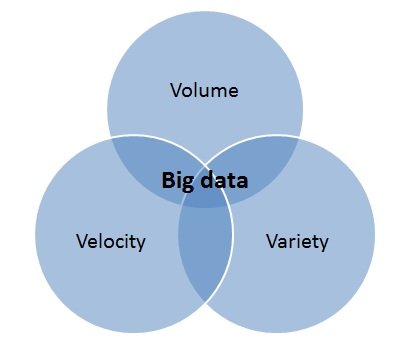
Big Data Volume
One of the key concepts to get to know when it comes to big data is volume.
There are a lot of companies and businesses that consume so much data, maybe because they have a lot of users or because they use AI to feed this data. This includes smart devices in our homes that are constantly learning and taking in their surroundings or something like Uber which has millions of customers at any time - and this is all adding lots of data to the mix.
To better explain this, let's take a look at some real-life examples of big data such as Facebook, that stores photographs.
Overall, it is thought Facebook stores a whopping 250 billion images in total. This isn’t even taking into account things such as Facebook posts - where there is thought to be approximately 2.5 trillion (and that is only from 2016 onwards).
For organisations using data to drive complex calculations and decisions, managing large volumes efficiently is essential. Optalitix Models enables businesses to deploy, manage and scale existing Excel, Python and R models in the cloud, making them accessible to operational systems through APIs.
Big Data Velocity
With big data, velocity refers to how quickly data is coming in. Using the Facebook example from earlier, whilst the social media giant stores 250 billion images, approximately 900 million photos are uploaded by its users each and every day.
With this colossal amount of data coming in every day, this has to be processed, filed and retrieved.
Another example of velocity is sensor data. With the Internet of Things taking off at a dramatic rate, we will be seeing more and more connected sensors. This will effectively mean more data being transmitted almost all the time.
Big Data Variety
The third sector of big data is variety. When discussing variety in reference to big data, it means that the data can be very different from one application to another, much of it being unstructured data too.
All of the data does not necessarily fit into one neat database application as it may have in the past.
A clear example of big date variety are emails. Messages are never identical to another, as each has its own destination, time stamp, possible attachments and different text. Emails, like audio recordings, videos and photos are all data that tends to be very varied and unstructured too.
How do the 3 Vs of big data apply to insurance?
The three Vs of big data are particularly relevant to insurance, where organisations rely on large volumes of information to assess risk, calculate premiums and make underwriting decisions.
- Volume: Insurers process significant amounts of policy, claims and customer data to support pricing and risk assessment.
- Velocity: Real-time data and automated workflows allow pricing and underwriting decisions to be made more quickly.
- Variety: Information from different sources, including spreadsheets, external datasets and third-party systems, needs to be combined and used consistently.
As the volume, velocity and variety of data increase, insurers need effective ways to connect their data with pricing models and operational systems.
Discover how modern pricing and underwriting technology helps insurers turn data into more efficient, consistent decisions.
Turning data into better business decisions
Understanding the three Vs of big data is an important first step. The next challenge is making that information accessible and useful across business processes.
Optalitix helps organisations operationalise their analytical and pricing models, connecting existing expertise with scalable technology and automated workflows.
Explore Optalitix Models to see how existing models can be deployed, integrated and managed more effectively.
More blogs

Cultural diversity drives better AI outcomes
Agile organisations that can respond to the global challenges of their often multinational customer base are often the ones that thrive.

Is the future of Lloyd’s algorithmic? - Part 2
Smart Follow underwriting and the algorithmic technology will bring a revolution of improved pricing and lower costs to insuring large and complex risks.

How does machine learning work?
Machine learning algorithms are a type of AI that can learn patterns and processes with minimal to no human intervention.