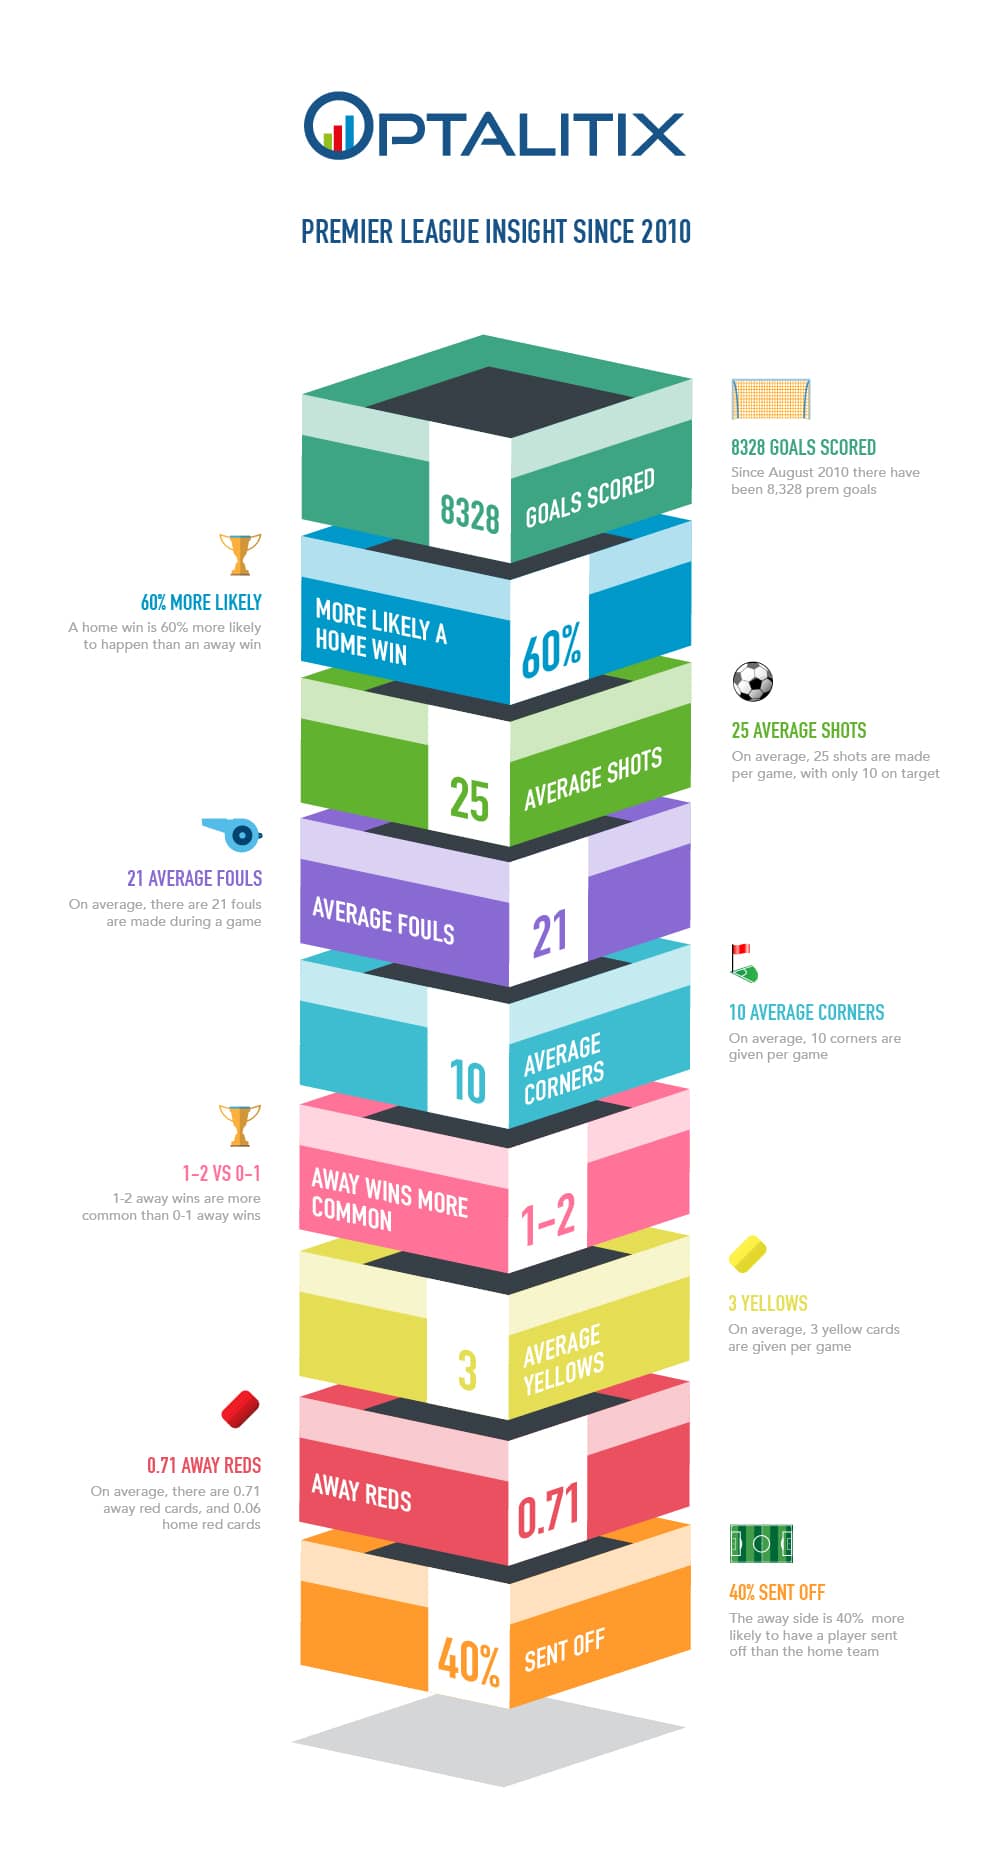
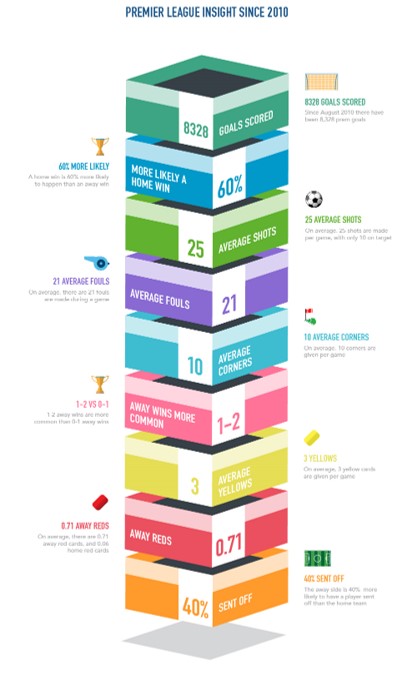
What is the most common Premier League scoreline? What should you expect to see more of in a game, fouls or shots at goal? Which team is more likely to have a player sent off, the home side or the visitors?
The football fans among you will no doubt have their answers to these questions ready by the end of this sentence. In fact, I reckon that even some of the casual fans will be giving these questions a moment’s thought. If you want to know the answers to these questions – along with many other Premier League (PL) stats – then the accompanying infographic is for you. If, however, you’re slightly curious as to how we got these numbers in the first place, read on.
Still, before we get to the good stuff, we need to go through the proper introductions.I work as an analyst for Optalitix, a company that delivers cutting edge, data based services, including database management and data analytics. I’m also a long-time supporter of a certain PL football team (name withheld for feeble reasons) and if there’s one thing I’ve learnt, it’s that there’s no quicker way than to win a tribal argument lively debate with a rival fan than with cold hard stats.
Why did we carry out this analysis into PL data? There are a number of answers. Football, like all sports, is awash with randomness and probabilities – being the data nerds that we are, the idea of being able to explain away the randomness, and quantify the unquantifiable, piqued our curiosity. We’d also recently finished work on an API modelling tool and were keen to see its application on something other than client data. Football data also has the advantages of being plentiful (if you’ve ever watched a football game on TV, you’ll have seen how frequently statistics flash up on the screen), not confidential and easily understandable by almost anyone who doesn’t live under a rock (or in the USA).
Besides, with the new Premier League season kicking off, could you really blame us for getting a little carried away with the whole football theme?
In order to carry out our research, we obtained historic data for the past 8 PL seasons (2010/11 – 2017/18). We didn’t go any further back – to, for instance, the inception of the PL in 1992 – because we assumed the relevance of the data decreases the further into the past you go (much to the chagrin of all Liverpool/Arsenal/Manchester United supporters).
Once we had compiled the data, we were able to look for key trends and patterns in the data (and settle some age-old debates with various colleagues). The fabled “home advantage” seemed like a good place to start - 57% of all goals are scored by the home side, and victory for the home team is the outcome of 46% of all matches. Needless to say, we soon found ourselves pretty far down the rabbit hole – did you know that Crystal Palace would have been relegated last season if all matches ended at half-time? And that they would have been just 1 point away from European football if only the second half of games counted?
The most common PL scoreline, by the way, is 1-1. I’ll leave it up to you to decide why that is.
Yoni Greis

Optalitix are Insurance Times Awards Gold Winner - Release
Optalitix wins the Gold award for Excellence in Technology – Service Provider (General) category at the 2021 prestigious Insurance Times Awards. Read more here.
The role of an underwriter should not be underestimated
The multi-faceted contribution an underwriter makes to any insurance business transcends simply assessing risk. Read more about underwriting and the impact of it.
Changes to FCA Insurance Pricing
New rules from 2022 ensure customers who are renewing their insurance policies receive a quote no more than they would be quoted as a new customer. Read more.
The future of systems with embedded Excel models
The ease with which Excel models can now be converted and the number available requires a new age of system design. Find out more in this guide.
Convert pricing models using an Excel converter.
Optalitix have determined that using Excel converters to convert pricing models is the most efficient and effective method. Take a look at the features and more.
Converting Spreadsheets - The 3 Options
At Optalitix, we are able to convert spreadsheets in 3 ways: by recoding the system, using an existing commercial platform, or using an Excel converter.
Spreadsheet models need to go digital
Spreadsheets should move to cloud-based systems in order to benefit from rich features such as dashboards, databases and seamlessly integrated AI and automation.
Spreadsheet dependancy and pricing
Spreadsheets are frequently used for pricing due to their ability to build complex calculations quickly in a flexible coding environment. Read our guide now.
Optalitix powered United Trust Bank’s step into the future with instant mortgage decisioning
The mortgage market is always changing. Few banks are able to offer an instant decision on a mortgage, yet the United Trust Bank (UTB) is one of them. Read more.
Five reasons why pricing in the cloud will increase sales
Cloud based pricing ensures that everything from conversion to compliance is streamlined, efficient and controlled ultimately leading to increased sales.
Spreadsheet Sense Check
As business strategy evolves and growth is more dependent on cloud based tools like AI, machine learning and data, the value of spreadsheets might be affected.

Big Data Processing for Multiple Insurers
The insurance sector is data rich and decisions are made quickly using real time data. Find out how GoCompare embraced AI to add value to their partner offering.
Learn about Lloyd’s Lab – an influential insurtech accelerator
Membership in Lloyd's Lab allowed Optalitix to scale up and develop innovative ideas in collaboration with the world's largest insurance market. Learn more now.
Learn about Mass Challenge – a US based start-up accelerator
